optical character recognition
The following blogpost is an excerpt from a project I completed for my machine learning class
Introduction:
Optical Character Recognition (OCR) is the process of identifying printed or handwritten characters and digitizing them. The technology is mostly used for the preservation of historical documents and digitizing the handwritten addresses on letters travelling through the postal service. Many techniques exist, including usage of neural networks, but this project will remain in the boundaries of what was covered in class.
Process:
For ease of labeling, the models will only be trained to identify numbers. Both the training and test sets will only include the number in the image, seeking characters in a wider image is beyond the scope of this project.

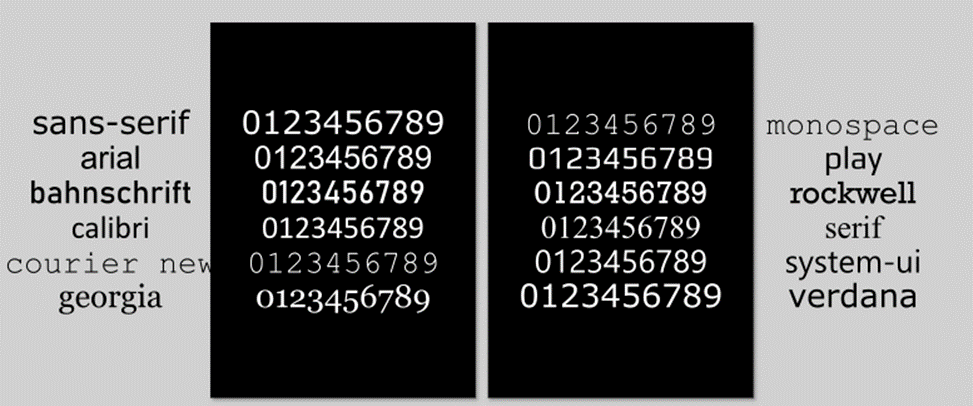
Figure 1 Twelve fonts were selected for this project. System-ui and Verdana will be the test fonts
The selected typefaces were arranged in an illustration program against a black background to maximize contrast. Each character was then isolated into its own image for further processing.
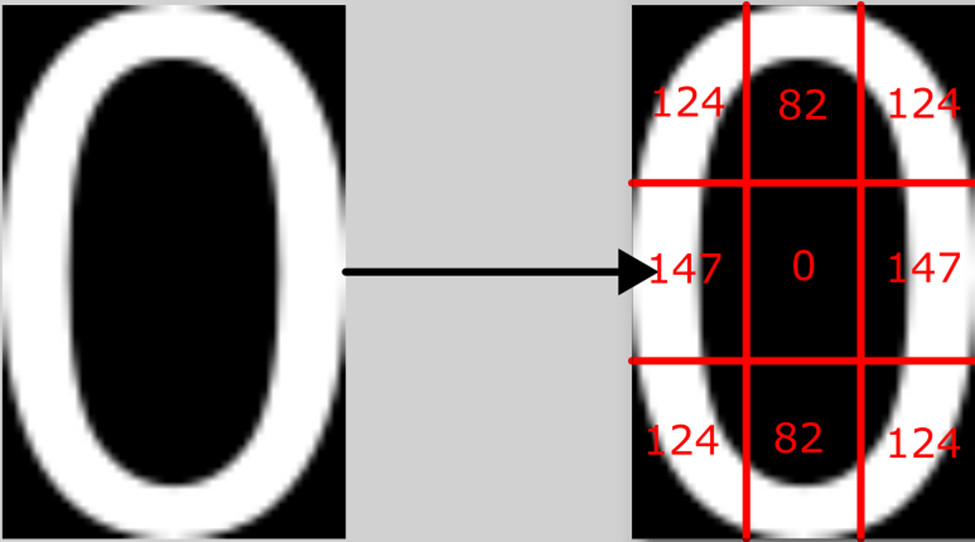
Using a python script, each image was divided into nine sections. The average pixel value in the section was extracted and placed into a CSV file.

Figure 3 Visual representation of what the python script is putting into the CSV. the value of the number is also put into the first column. Any numerical inconsistencies can be attributed to pixel antialiasing
The data is preprocessed and ready for use in R.

Figure 4 There is enough difference between the values of 0 for this to be a suitable exercise
Training and Testing:
This is a classification problem with 10 classes and 9 parameters. Each class has 10 training values and 2 test values. The findings for each approach is listed below.
K Means:

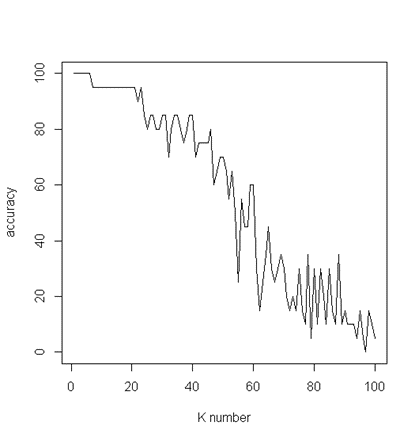
Figure 5 Graph depicts k value and corresponding accuracy. K=100 includes the entire dataset into consideration for test
Observations from the confusion matrix (Figure 6) suggest errors in the approach to this experiment. Each character has variable width, unless it’s a monospace font. 1 is usually very thin, but is sometimes depicted with the footer. This throws the results off as monospace 1s have most of their pixels in the middle, while regular fonts are skewed towards the right. It would be interesting to compare the results from this experiment and another where the characters are saved in a fixed width image. For sufficiently low K values, this doesn’t appear to matter.

Figure 6 K=25. 1s get confused as 2s and 3s. 3s get confused as 2s
Decision Tree:

Figure 7 It appears as if 4 is unlike most other numerals because it doesn’t occupy the top middle portion of the glyph as often as others.
The program split the decision tree into categories that people could make. Is the center (V6) empty? It is probably 0. Is everything full? It is probably 1.
Conclusion:
Usage of this dataset and techniques wouldn’t be suitable for a finished product but could be used in conjunction with another technology that could isolate characters from a larger image. Originally, I thought that OCR could only really be achieved by convolutional neural networks, but this exercise proves that lighter algorithms may also be effective. If I were to do this project again, I’d like to expand it to more fonts and introduce some variance into the dataset. This would include warping, partially obscuring, inverting, discoloring the numbers. If there was less pre-processing involved, I would also be intrigued to see its performance against handwritten numbers and printed numbers. Even if the printed number fonts were the same, the contrast would be different since the photo would have different lighting conditions.